

Overview & First Login
OpenLinker’s admin UI is a browser-first single-page application. Everything — connections, catalog, orders, diagnostics — lives in one place, organized around a persistent left sidebar. This section walks you through logging in for the first time and getting your bearings.
First Login
Section titled “First Login”Navigate to the OpenLinker web app in your browser. In a local dev setup the default address is http://localhost:4173; on a production install it’s whatever hostname you’ve configured.
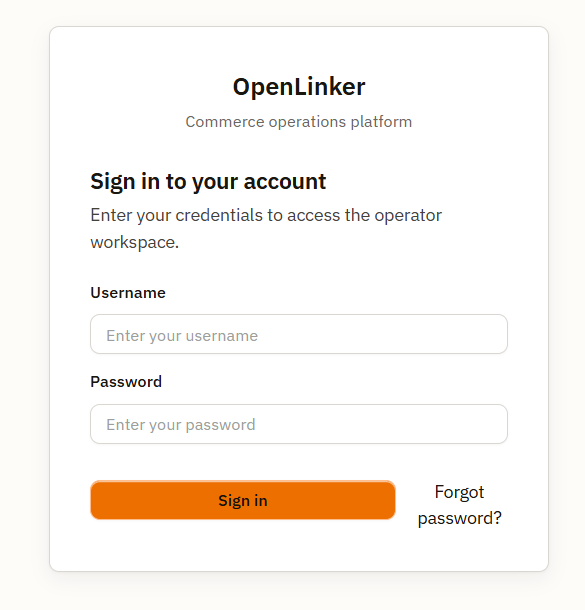
Enter your admin credentials. On first boot the API prints a one-time default password to the log:
[BootstrapAdminService] Default admin credentials: username=admin password=<generated>If you’ve lost your password, click Forgot password? — the API logs the reset link to its console output.
After a successful login you land on the Dashboard.
Shell Layout
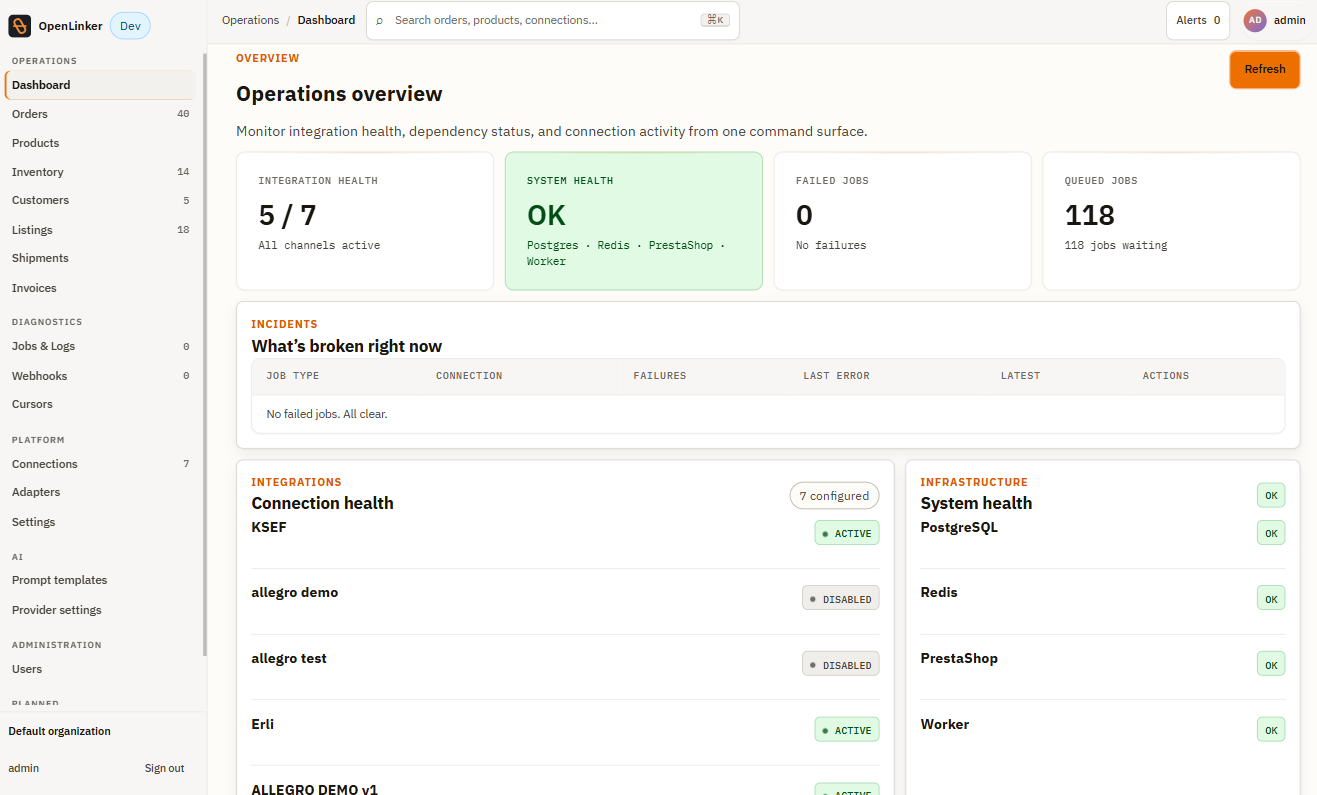
Section titled “Shell Layout”The admin UI follows a fixed shell: persistent left sidebar, top utility bar, and a main workspace area.
Left Sidebar
Section titled “Left Sidebar”The sidebar is always visible and organized into groups, separated by frequency of use:
Operations — the surfaces you touch daily:
- Dashboard — system health overview, connection status, and job activity at a glance
- Orders — every order ingested from any connected source
- Products — the synced product catalog from your master shop
- Inventory — per-variant stock levels pulled from your master shop
- Customers — customer projections built from order data
- Listings — marketplace offers managed by OpenLinker
- Shipments — shipment tracking and dispatch
- Invoices — issued/pending/failed invoices per order, with regulatory (e.g. KSeF) clearance status — see Invoices
Diagnostics — when something needs investigation:
- Jobs & Logs — every background sync job: status, payload, and detail
- Webhooks — inbound webhook delivery log with payload inspector
- Cursors — sync-progress bookmarks; reset one here if a sync stalls
Platform — one-time and occasional configuration:
- Connections — your connected platforms (PrestaShop, Allegro, WooCommerce, …)
- Adapters — registered adapter manifests (read-only metadata)
- Settings — platform configuration and account info
AI — AI content generation tools:
- Prompt templates — editable prompts used when generating offer descriptions
- Provider settings — configure and activate an AI provider (Anthropic / OpenAI)
Below the AI group you’ll see Automations listed in a muted style. This is a planned future feature — it is not yet functional and is not covered by this guide.
Top Bar
Section titled “Top Bar”The top bar carries:
- Environment/workspace name — useful when you run multiple OpenLinker instances
- Alerts badge — unread alert count
- Theme toggle — switch between light and dark mode; the preference is stored in your browser
- User menu — log out and account settings
Dashboard
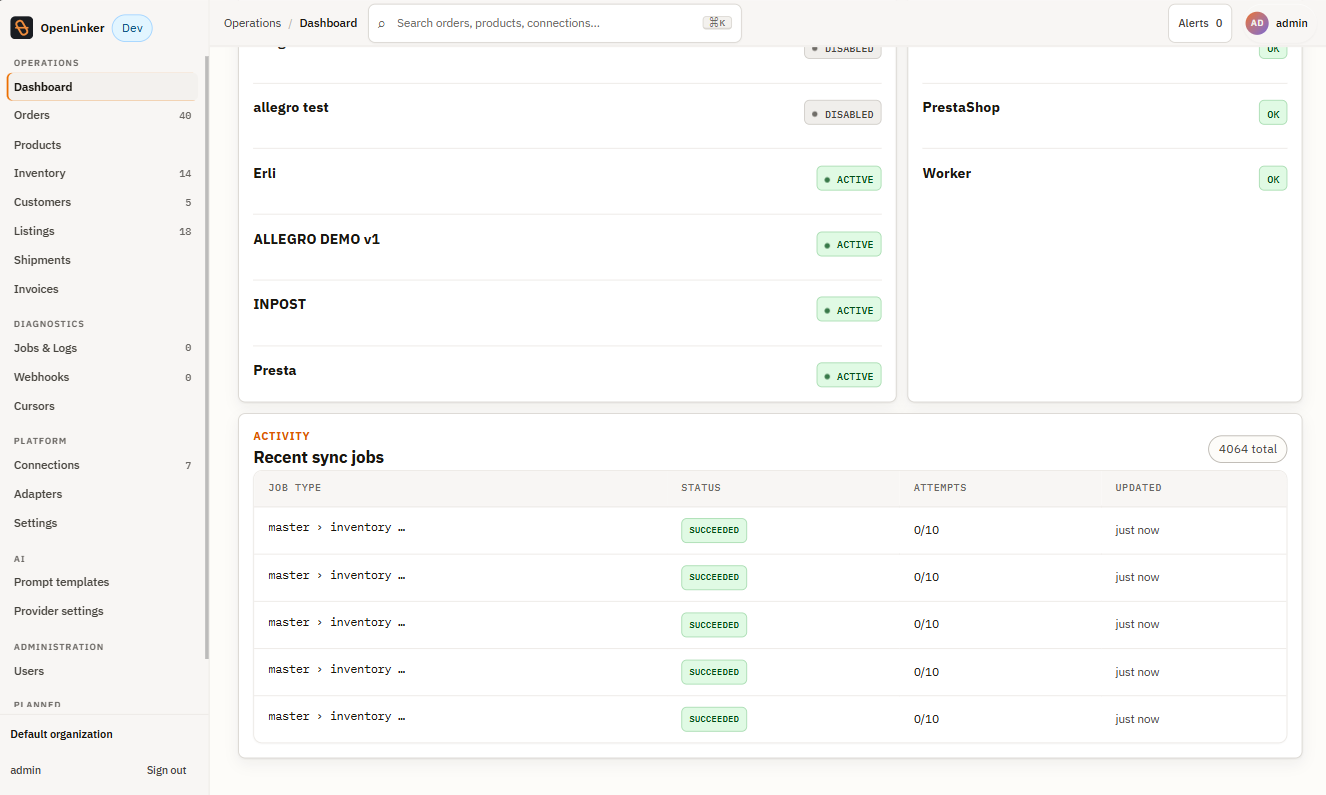
Section titled “Dashboard”The Dashboard is your at-a-glance view of system and integration health.
Summary cards
Section titled “Summary cards”Four cards at the top give a quick health read:
| Card | What it shows |
|---|---|
| Integration health | 5 / 7 — how many connections are active out of the total configured |
| System health | OK when all core dependencies (PostgreSQL, Redis, PrestaShop, Worker) are reachable |
| Failed jobs | Count of jobs in dead state that need attention |
| Queued jobs | Jobs currently waiting to be picked up by the worker |
Incidents panel
Section titled “Incidents panel”The INCIDENTS — What’s broken right now panel lists any connections or system components that are currently in an error state. An empty panel (“No failed jobs. All clear.”) means everything is healthy.
Connection health & Infrastructure
Section titled “Connection health & Infrastructure”Two side-by-side sections show:
- INTEGRATIONS — Connection health — per-connection status chip (ACTIVE / error) for each configured platform (e.g. Allegro, Pretashop)
- INFRASTRUCTURE — System health — PostgreSQL, Redis, PrestaShop module, and Worker process — each with an OK / error chip
Recent sync jobs
Section titled “Recent sync jobs”The ACTIVITY — Recent sync jobs table at the bottom shows the latest background jobs across all connections: job type, status chip, attempt count, and last-updated timestamp. Use this as a quick sanity check that syncs are running.
Theme toggle
Section titled “Theme toggle”Click the sun/moon icon in the top-right of the top bar to switch between light and dark mode. The choice is stored in your browser and persists across sessions.
What’s next
Section titled “What’s next”With the layout in mind, the next step is connecting a platform: